The statistics provided in this release are based on information from the ITSO MLS® System. Multiple MLS® Systems operate within Ontario, and while none can be guaranteed to include every property listed or sold within a given area, they effectively illustrate market trends.
“The September housing market continues to reflect broader economic conditions, with sales remaining below both last year’s levels and the ten-year average,” says Christal Moura, spokesperson for the Waterloo Region market. “While sales volumes have moderated from last year, this shift has created a more balanced market where buyers can take time with their decisions. Well-priced properties continue to attract attention, and experienced REALTORS® are helping both buyers and sellers navigate these changing conditions successfully.”
Total residential sales in September included 325 detached homes (down 4.1 per cent from September 2024), and 91 townhouses (down 5.2 per cent). Sales also included 51 condominium units (down 13.6 per cent) and 34 semi-detached homes (up 6.3 per cent).
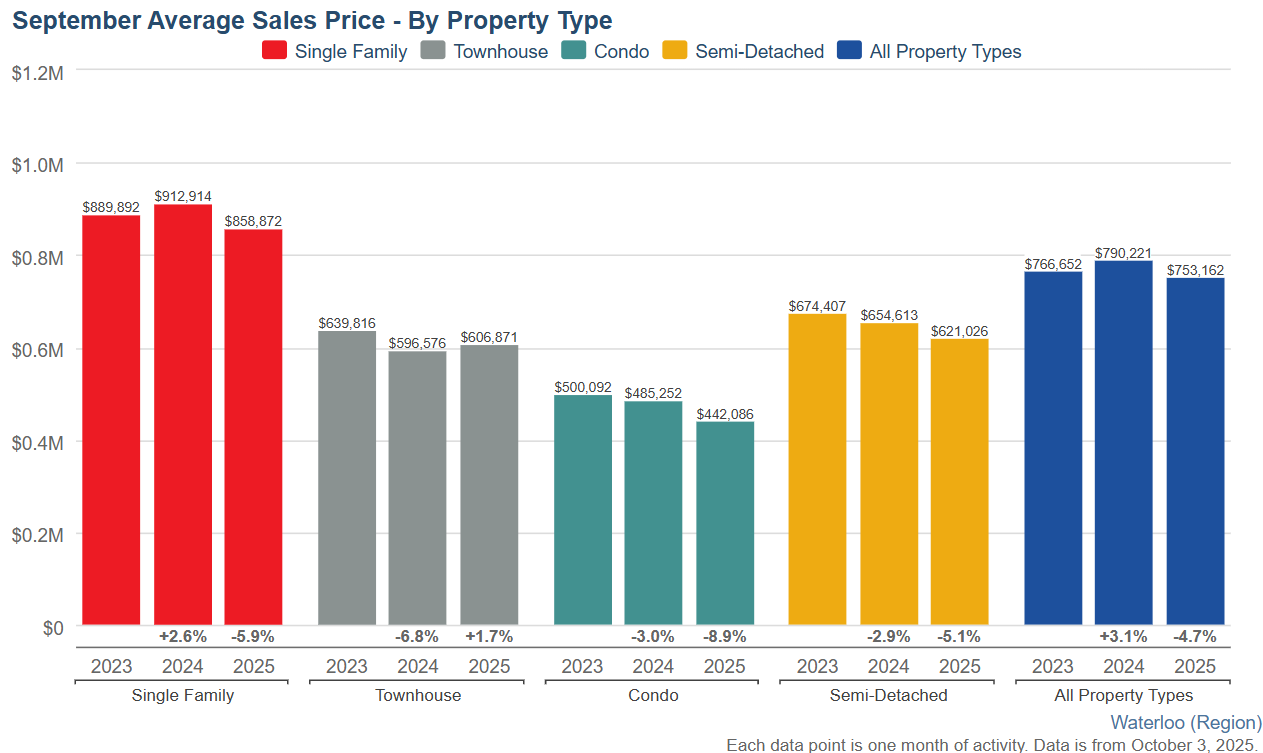
In September, the average sale price for all residential properties in Waterloo Region was $753,162. This represents a 4.7 per cent decrease compared to September 2024 and a 3.2 per cent increase compared to August 2025.
There were 1,469 new listings added to the MLS® System in Waterloo Region last month, an increase 11.0 per cent compared to September last year and a 32.9 per cent increase compared to the previous ten-year average for September.
The total number of homes available for sale in active status at the end of September was 2,094, an increase of 22.2 per cent compared to September of last year and 79.5 per cent above the previous ten-year average of 1,167 listings for September.
The total inventory across the market increased by 29.0 percent, resulting in a 4.0-month supply of all property types by the end of September. Condominium apartments had the highest inventory, with 7.3 months’ supply, followed by townhouses with 4.8 months’ supply and detached homes with 3.3 months’ supply. The number of months of inventory represents the time it would take to sell all current inventories at the current sales rate.
The average time to sell a home in September was 32 days, which was the same in the previous month. In September 2024, it took 28 days for a home to sell, and the five-year average was 19 days.
View our HPI tool here to learn more: https://www.cornerstone.inc/stats/
WATERLOO REGION, ON (October 3, 2025) —In September, a total of 502 homes were sold in the Waterloo Region via the Multiple Listing Service® (MLS®) System of the Cornerstone Association of REALTORS® (Cornerstone). This represents a 4.7 per cent decrease compared to the same period last year and a decline of 25.0 per cent compared to the average number of homes sold in the previous ten years for the same month.
“The September housing market continues to reflect broader economic conditions, with sales remaining below both last year’s levels and the ten-year average,” says Christal Moura, spokesperson for the Waterloo Region market. “While sales volumes have moderated from last year, this shift has created a more balanced market where buyers can take time with their decisions. Well-priced properties continue to attract attention, and experienced REALTORS® are helping both buyers and sellers navigate these changing conditions successfully.”
Total residential sales in September included 325 detached homes (down 4.1 per cent from September 2024), and 91 townhouses (down 5.2 per cent). Sales also included 51 condominium units (down 13.6 per cent) and 34 semi-detached homes (up 6.3 per cent).
In September, the average sale price for all residential properties in Waterloo Region was $753,162. This represents a 4.7 per cent decrease compared to September 2024 and a 3.2 per cent increase compared to August 2025.
- The average sale price of a detached home was $858,872. This represents a 5.9 per cent decrease from September 2024 and an increase of 1.4 per cent compared to August 2025.
- The average sale price for a townhouse was $606,871. This represents a 1.7 per cent increase from September 2024 and an increase of 1.8 per cent compared to August 2025.
- The average sale price for an apartment-style condominium was $442,086. This represents a 8.9 per cent decrease from September 2024 and an increase of 2.0 per cent compared to August 2025.
- The average sale price for a semi was $621,026. This represents a decrease of 5.1 per cent compared to September 2024 and an increase of 0.5 per cent compared to August 2025.
While prices have softened compared to last year, the market is finding its balance. Buyers now have more choice due to inventory levels well above the ten-year average. Moura believes that the fundamentals of our region—its diverse economy, dynamic technology ecosystem, and strong talent base—remain solid foundations of our housing market.
There were 1,469 new listings added to the MLS® System in Waterloo Region last month, an increase 11.0 per cent compared to September last year and a 32.9 per cent increase compared to the previous ten-year average for September.
The total number of homes available for sale in active status at the end of September was 2,094, an increase of 22.2 per cent compared to September of last year and 79.5 per cent above the previous ten-year average of 1,167 listings for September.
The total inventory across the market increased by 29.0 percent, resulting in a 4.0-month supply of all property types by the end of September. Condominium apartments had the highest inventory, with 7.3 months’ supply, followed by townhouses with 4.8 months’ supply and detached homes with 3.3 months’ supply. The number of months of inventory represents the time it would take to sell all current inventories at the current sales rate.
The average time to sell a home in September was 32 days, which was the same in the previous month. In September 2024, it took 28 days for a home to sell, and the five-year average was 19 days.
View our HPI tool here to learn more: https://www.cornerstone.inc/stats/
CORNERSTONE cautions that average sale price information can help establish long-term trends but does not indicate specific properties have increased or decreased in value. The MLS® Home Price Index (HPI) provides the best way to gauge price trends because averages are strongly distorted by changes in the mix of sales activity from one month to the next.